| Diesel & Motor Engineering PLC | |
|---|---|
| LOCAL | FOREIGN |
| DIMO (Pvt) Ltd | DIMO Global PTE LTD |
| Plant Seeds (Pvt) Ltd | Azendtech LLC-FZ |
| PlantChem (Pvt) Ltd | DIMO Australia Pty Ltd |
| DIMO Travels (Pvt) Ltd | DIMO Coastelin Pvt Ltd |
| DIMO Industries (Pvt) Ltd | DIMO Bangladesh Pvt Ltd |
| DIMO Lifeline (Private) Limited | Diesel & Motor Engineering PLC-Uganda Branch |
| Moveflex (Private) Limited | DIMO Lanka Company Ltd |
| Virgin Oil International (Pvt) Ltd | United DIMO Company Ltd |
| Azend Technologies (Pvt) Ltd | |
| Mansel Ceylon (Pvt) Ltd | |
| Associated Laboratories (Pvt) Ltd | |
| Tropical Health Food (Pvt) Ltd | |
| DI Solar Beliatta (Pvt) Ltd | |
| DIMO Solar Anuradhapura (Pvt) Ltd | |
| DIMO Solar Galle (Pvt) Ltd | |
| DIMO Solar Galle Two (Pvt) Ltd | |
| DIMO Solar Galle Three (Pvt) Ltd | |
| DIMO Solar Galle Four (Pvt) Ltd | |
| DIMO Academy of Higher Education (Pvt) Ltd | |
The Names and the Number of Shares held by the Twenty Largest Shareholders of the Company
| Name | As at 31st March 2024 | As at 31st March 2023 | Movement | |||
|---|---|---|---|---|---|---|
| Shares | % | Shares | % | Shares | % | |
| Employee's Provident Fund | 1,835,870 | 19.89 | 1,835,870 | 19.89 | - | - |
| A.R. Pandithage | 1,030,882 | 11.17 | 1,030,882 | 11.17 | - | - |
| J.C. Pandithage | 976,042 | 10.57 | 976,042 | 10.57 | - | - |
| A & G Investments Pvt Limited | 667,395 | 7.23 | 667,395 | 7.23 | - | - |
| S.C. Algama | 590,497 | 6.40 | 590,497 | 6.40 | - | - |
| A.G. Pandithage | 546,846 | 5.92 | 546,846 | 5.92 | - | - |
| C.R. Pandithage | 228,144 | 2.47 | 222,644 | 2.41 | 5,500 | 2.47 |
| A.N. Algama | 222,288 | 2.41 | 222,288 | 2.41 | - | - |
| Almar Trading Co (Pvt) Ltd | 198,900 | 2.15 | 198,900 | 2.15 | - | - |
| A.M. Pandithage | 189,611 | 2.05 | 189,611 | 2.05 | - | - |
| T.G.H. Peries | 189,407 | 2.05 | 189,407 | 2.05 | - | - |
| D. Jayanntha | 166,400 | 1.80 | 166,400 | 1.80 | - | - |
| T.R.N.C. Peries | 153,929 | 1.67 | 153,929 | 1.67 | - | - |
| L.P. Algama | - | - | 139,951 | 1.52 | (139,951) | (100) |
| N.U. Algama | 123,598 | 1.34 | 123,598 | 1.34 | - | - |
| Ideal Automobile (Pvt) Ltd | 87,938 | 0.95 | 87,938 | 0.95 | - | - |
| M.I. Algama | 69,976 | 0.76 | 69,976 | 0.76 | - | - |
| L.S. Algama | 69,975 | 0.76 | 69,975 | 0.76 | - | - |
| Bank of Ceylon No. 1 Account | 61,054 | 0.66 | 61,054 | 0.66 | - | - |
| H.S. Pandithage | - | - | 46,849 | 0.51 | (46,849) | (100) |
| Rubber Investment Trust Ltd A/C No 01 | 52,761 | 0.57 | - | - | 52,761 | 100 |
| I.S. Salgado | 47,840 | 0.52 | - | - | 47,840 | 100 |
| Total | 7,509,353 | 81.34 | 7,590,052 | 82.22 | (80,699) | (1) |
The table mentioned below shows some relevant ratios including net assets value per share, EPS, assets turnover ratio and market price of the shares over last ten years.
| Financial Year | Paid up/ Stated Capital | Reserves | Total Equity | Growth Rate | EPS (Rs.) | Total Assets | Total Turnover | Total Assets to Net Turnover Ratio | Net Assets Value Per Share | Market Price of Share | ||
|---|---|---|---|---|---|---|---|---|---|---|---|---|
| Highest | Lowest | Closing | ||||||||||
| 2014/15 | 425,297 | 8,812,641 | 9,237,938 | - | 67.15 | 18,072,289 | 28,037,376 | 1.551 | 1,040.73 | 730 | 485 | 630 |
| 2015/16 | 425,297 | 9,564,382 | 9,989,679 | 8.53% | 106.64 | 20,332,644 | 37,749,750 | 1.857 | 1,125.42 | 799 | 520.1 | 549.7 |
| 2016/17 | 425,297 | 9,739,645 | 10,164,942 | 1.83% | 73.99 | 22,759,418 | 44,492,990 | 1.955 | 1,145.16 | 790 | 542 | 559.9 |
| 2017/18 | 425,297 | 11,655,064 | 12,080,361 | 19.67% | 58.50 | 28,572,362 | 43,686,158 | 1.529 | 1,326.68 | 639 | 462 | 464.9 |
| 2018/19 | 425,297 | 11,655,154 | 12,080,451 | 0.00% | 5.78 | 29,300,192 | 38,300,350 | 1.307 | 1,322.70 | 475 | 290 | 304.7 |
| 2019/20 | 425,297 | 11,923,634 | 12,348,931 | 2.30% | 21.97 | 32,025,571 | 34,557,871 | 1.079 | 1,349.53 | 350 | 245 | 250 |
| 2020/21 | 425,297 | 14,535,955 | 14,961,252 | 21.91% | 52.72 | 32,116,151 | 30,819,014 | 0.960 | 1,638.27 | 672 | 188 | 530.25 |
| 2021/22 | 620,578 | 14,845,909 | 15,466,487 | 2.13% | 76.06 | 40,304,990 | 37,507,480 | 0.931 | 1,696.73 | 1,450 | 451 | 488 |
| 2022/23 | 620,578 | 14,733,053 | 15,353,631 | -0.76% | 62.73 | 39,562,387 | 35,299,201 | 0.892 | 1,622.31 | 740 | 280 | 466 |
| 2023/24 | 620,578 | 16,228,057 | 16,848,635 | 10.15% | 4.65 | 48,992,998 | 44,217,038 | 0.903 | 1,671.23 | 550 | 471.5 | 513.25 |
| For the year ended 31st March | Note | Group | Company | ||||
|---|---|---|---|---|---|---|---|
| 2024 Rs.'000 | 2023 Rs.'000 | Change % | 2024 Rs.'000 | 2023 Rs.'000 | Change % | ||
| Revenue | 4.1 | 43,644,295 | 35,299,201 | 24 | 32,557,940 | 26,668,117 | 22 |
| Cost of sales | (31,790,151) | (22,556,267) | (41) | (23,364,689) | (16,256,088) | (44) | |
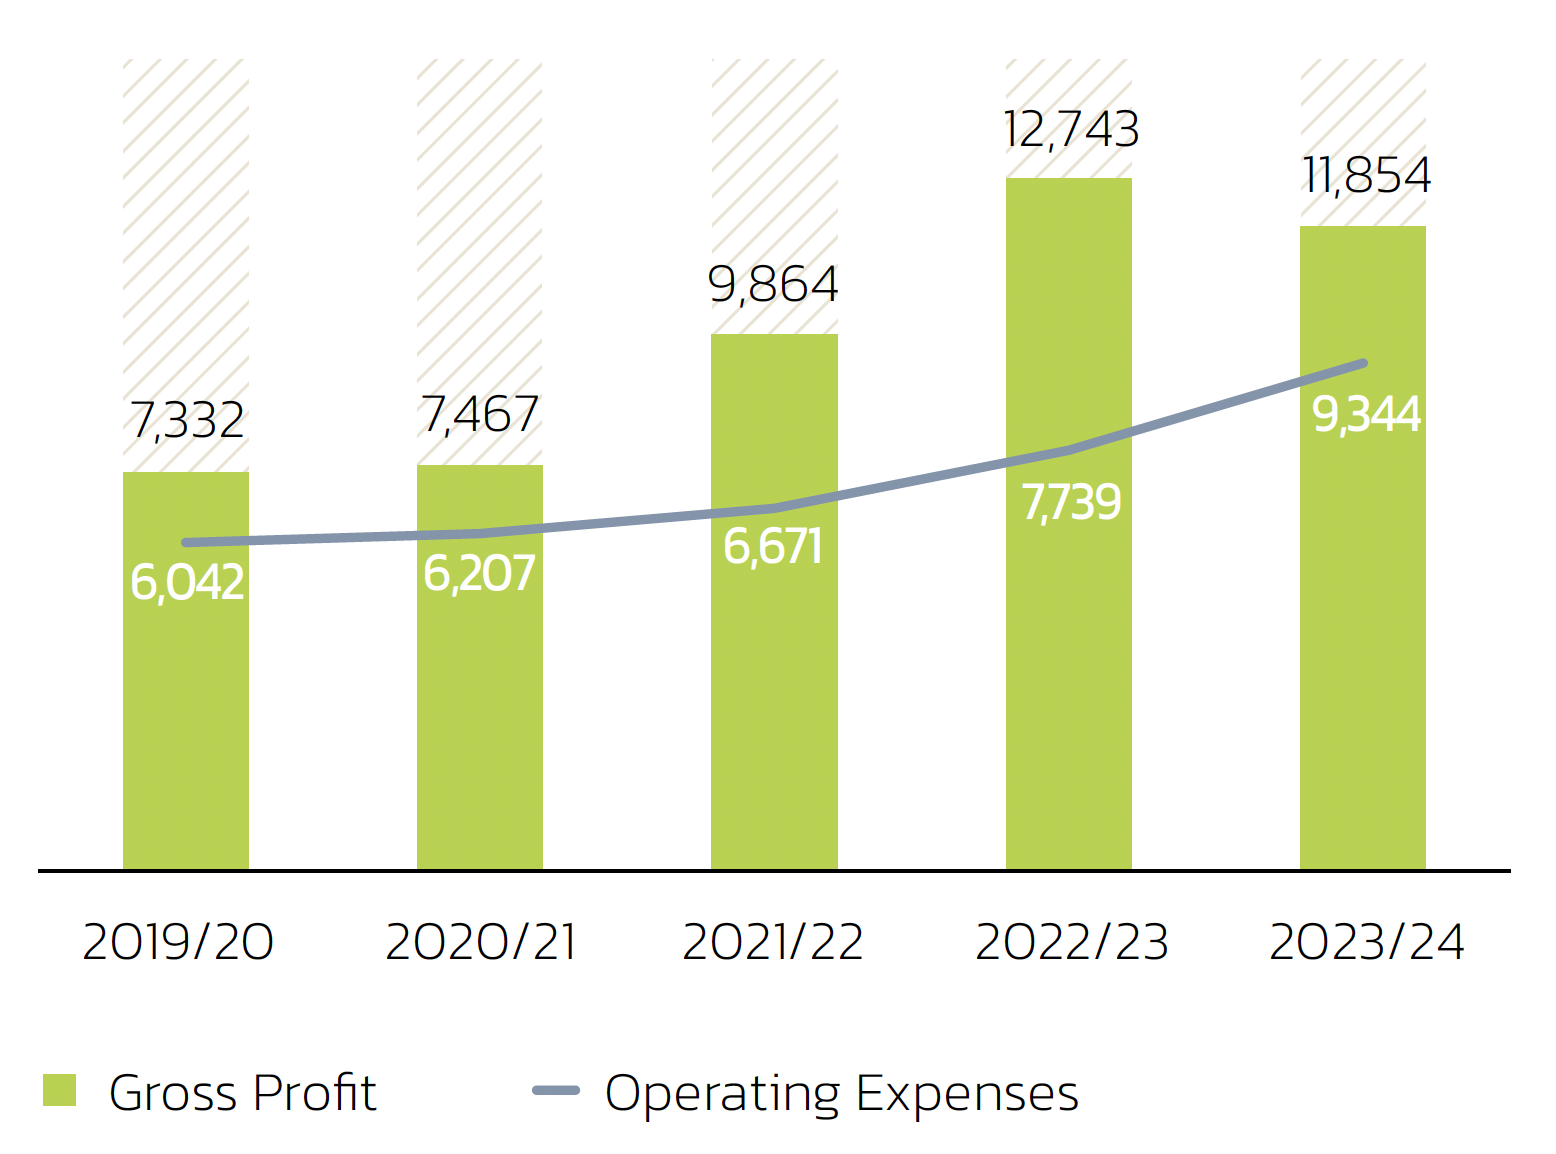
| Gross profit | 11,854,144 | 12,742,934 | (7) | 9,193,251 | 10,412,029 | (12) | |
| Other operating income | 4.3 | 575,243 | 295,694 | 95 | 771,686 | 511,783 | 51 |
| Selling and distribution expenses | (884,002) | (536,020) | 65 | (804,412) | (496,629) | 62 | |
| Impairment loss on trade receivables | 4.16.1 | (105,241) | (79,680) | 41 | (50,790) | (124,838) | 59 |
| Administrative expenses | (8,354,442) | (7,123,775) | 17 | (6,773,205) | (5,768,198) | 17 | |
| Operating profit | 3,085,702 | 5,299,153 | (42) | 2,336,530 | 4,534,147 | (48) | |
| Finance income | 58,173 | 141,859 | (59) | 669,087 | 491,979 | 36 | |
| Finance costs | (2,992,174) | (4,708,351) | (36) | (2,519,671) | (4,232,256) | (40) | |
| Net finance costs | 4.4 | (2,934,001) | (4,566,492) | (36) | (1,850,584) | (3,740,277) | (51) |
| Share of results of equity-accounted investees, net of tax | 4.12.5 | 31,410 | 4,595 | 584 | 31,410 | 4,595 | 584 |
| Profit before tax | 4.5 | 183,111 | 737,256 | (75) | 517,356 | 798,485 | (35) |
| Income tax expense | 4.6.2 | (90,506) | (39,112) | 131 | (159,332) | (154,649) | 3 |
| Profit for the year | 92,605 | 698,144 | (87) | 358,024 | 643,816 | (44) | |
| Other Comprehensive Income | |||||||
| Items that will not be reclassified to profit or loss in subsequent periods | |||||||
| Remeasurement (loss)/gain on defined benefit obligation | 4.23.1 | (83,285) | 49,315 | (269) | (63,026) | 42,712 | (248) |
| Deferred tax reversal/(charge) on actuarial (loss)/gain | 4.24.1 | 24,986 | (13,660) | 283 | 18,908 | (12,814) | 248 |
| Revaluation of freehold land | 4.9 | 2,208,774 | - | 100 | 2,179,200 | - | 100 |
| Deferred tax charge on land revaluation | 4.24.3 | (665,654) | - | 100 | (653,760) | - | 100 |
| Income tax rate change impact on revaluation of freehold land | 4.21.1 | - | (493,462) | (100) | - | (480,800) | (100) |
| Net change in fair value of equity investments at FVOCI | 2,687 | (1,604) | (267) | 2,687 | (2,529) | (206) | |
| Items that are or may be reclassified to profit or loss in subsequent periods | |||||||
| Foreign currency translation differences of foreign operations | 4.21.2 | (53,543) | (87,509) | (39) | (21,040) | (58,313) | (64) |
| Total other comprehensive income, net of tax | 1,433,965 | (546,920) | (362) | 1,462,969 | (511,744) | (386) | |
| Total comprehensive income for the year | 1,526,570 | 151,224 | 909 | 1,820,993 | 132,072 | 1,279 | |
| Profit attributable to: | |||||||
| Equity holders of the parent | 42,962 | 579,060 | (93) | 358,024 | 643,816 | (44) | |
| Non-controlling interest | 49,643 | 119,084 | (58) | - | - | - | |
| 92,605 | 698,144 | (87) | 358,024 | 643,816 | (44) | ||
| Total comprehensive income attributable to: | |||||||
| Equity holders of the parent | 1,477,282 | 33,403 | 4,323 | 1,820,993 | 132,072 | 1,279 | |
| Non-controlling interest | 49,288 | 117,821 | (58) | - | - | - | |
| 1,526,570 | 151,224 | 909 | 1,820,993 | 132,072 | 1,279 | ||
| Basic and diluted earnings per share (Rs.) | 4.7 | 4.65 | 62.73 | 38.78 | 69.74 | ||
| Dividend per share (Rs.) | 4.8 | - | - | 10.00 | 12.50 | ||